


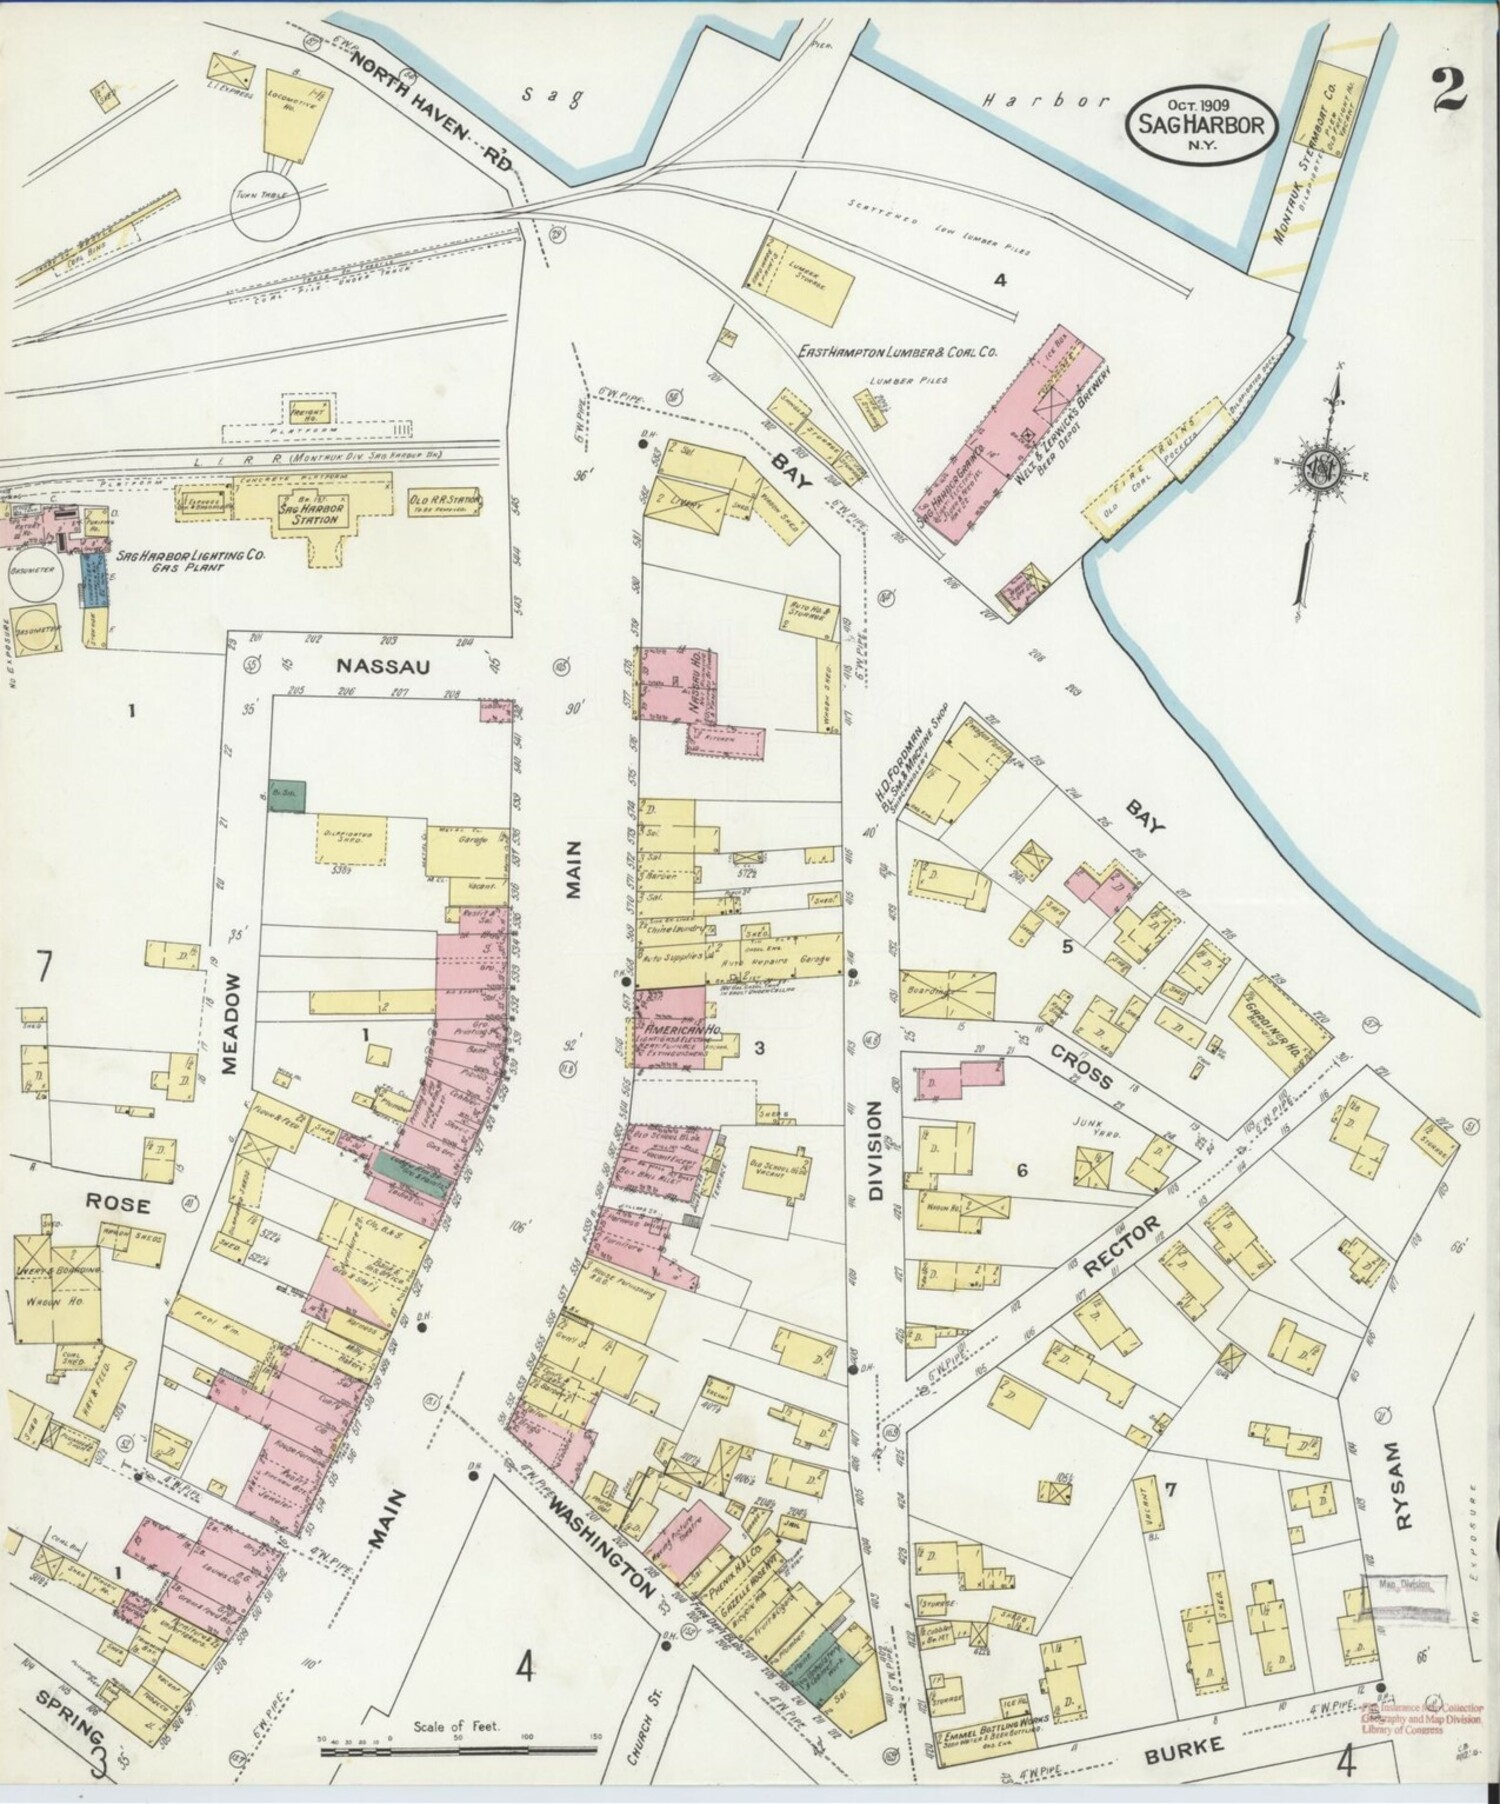
A 1909 Sanborn Insurance Co. Map of Sag Harbor. COURTESY LIBRARY OF CONGRESS
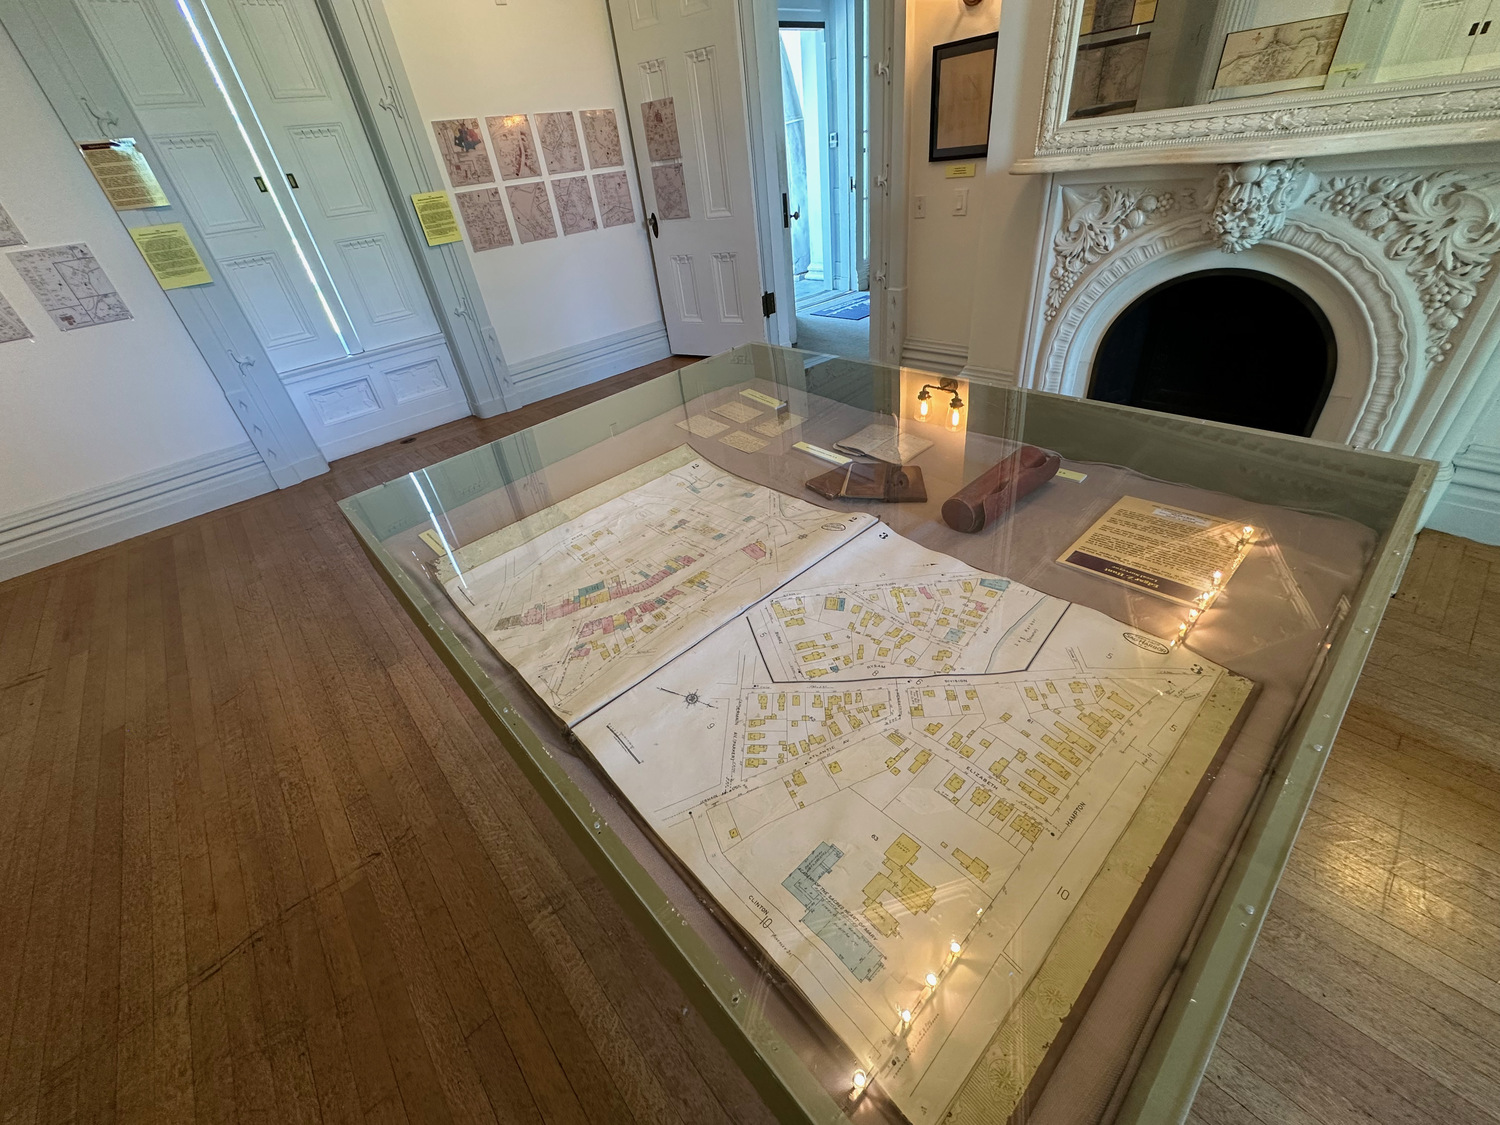
A view of the map exhibit on view at the Sag Harbor Whaling Museum. ANNETTE HINKLE
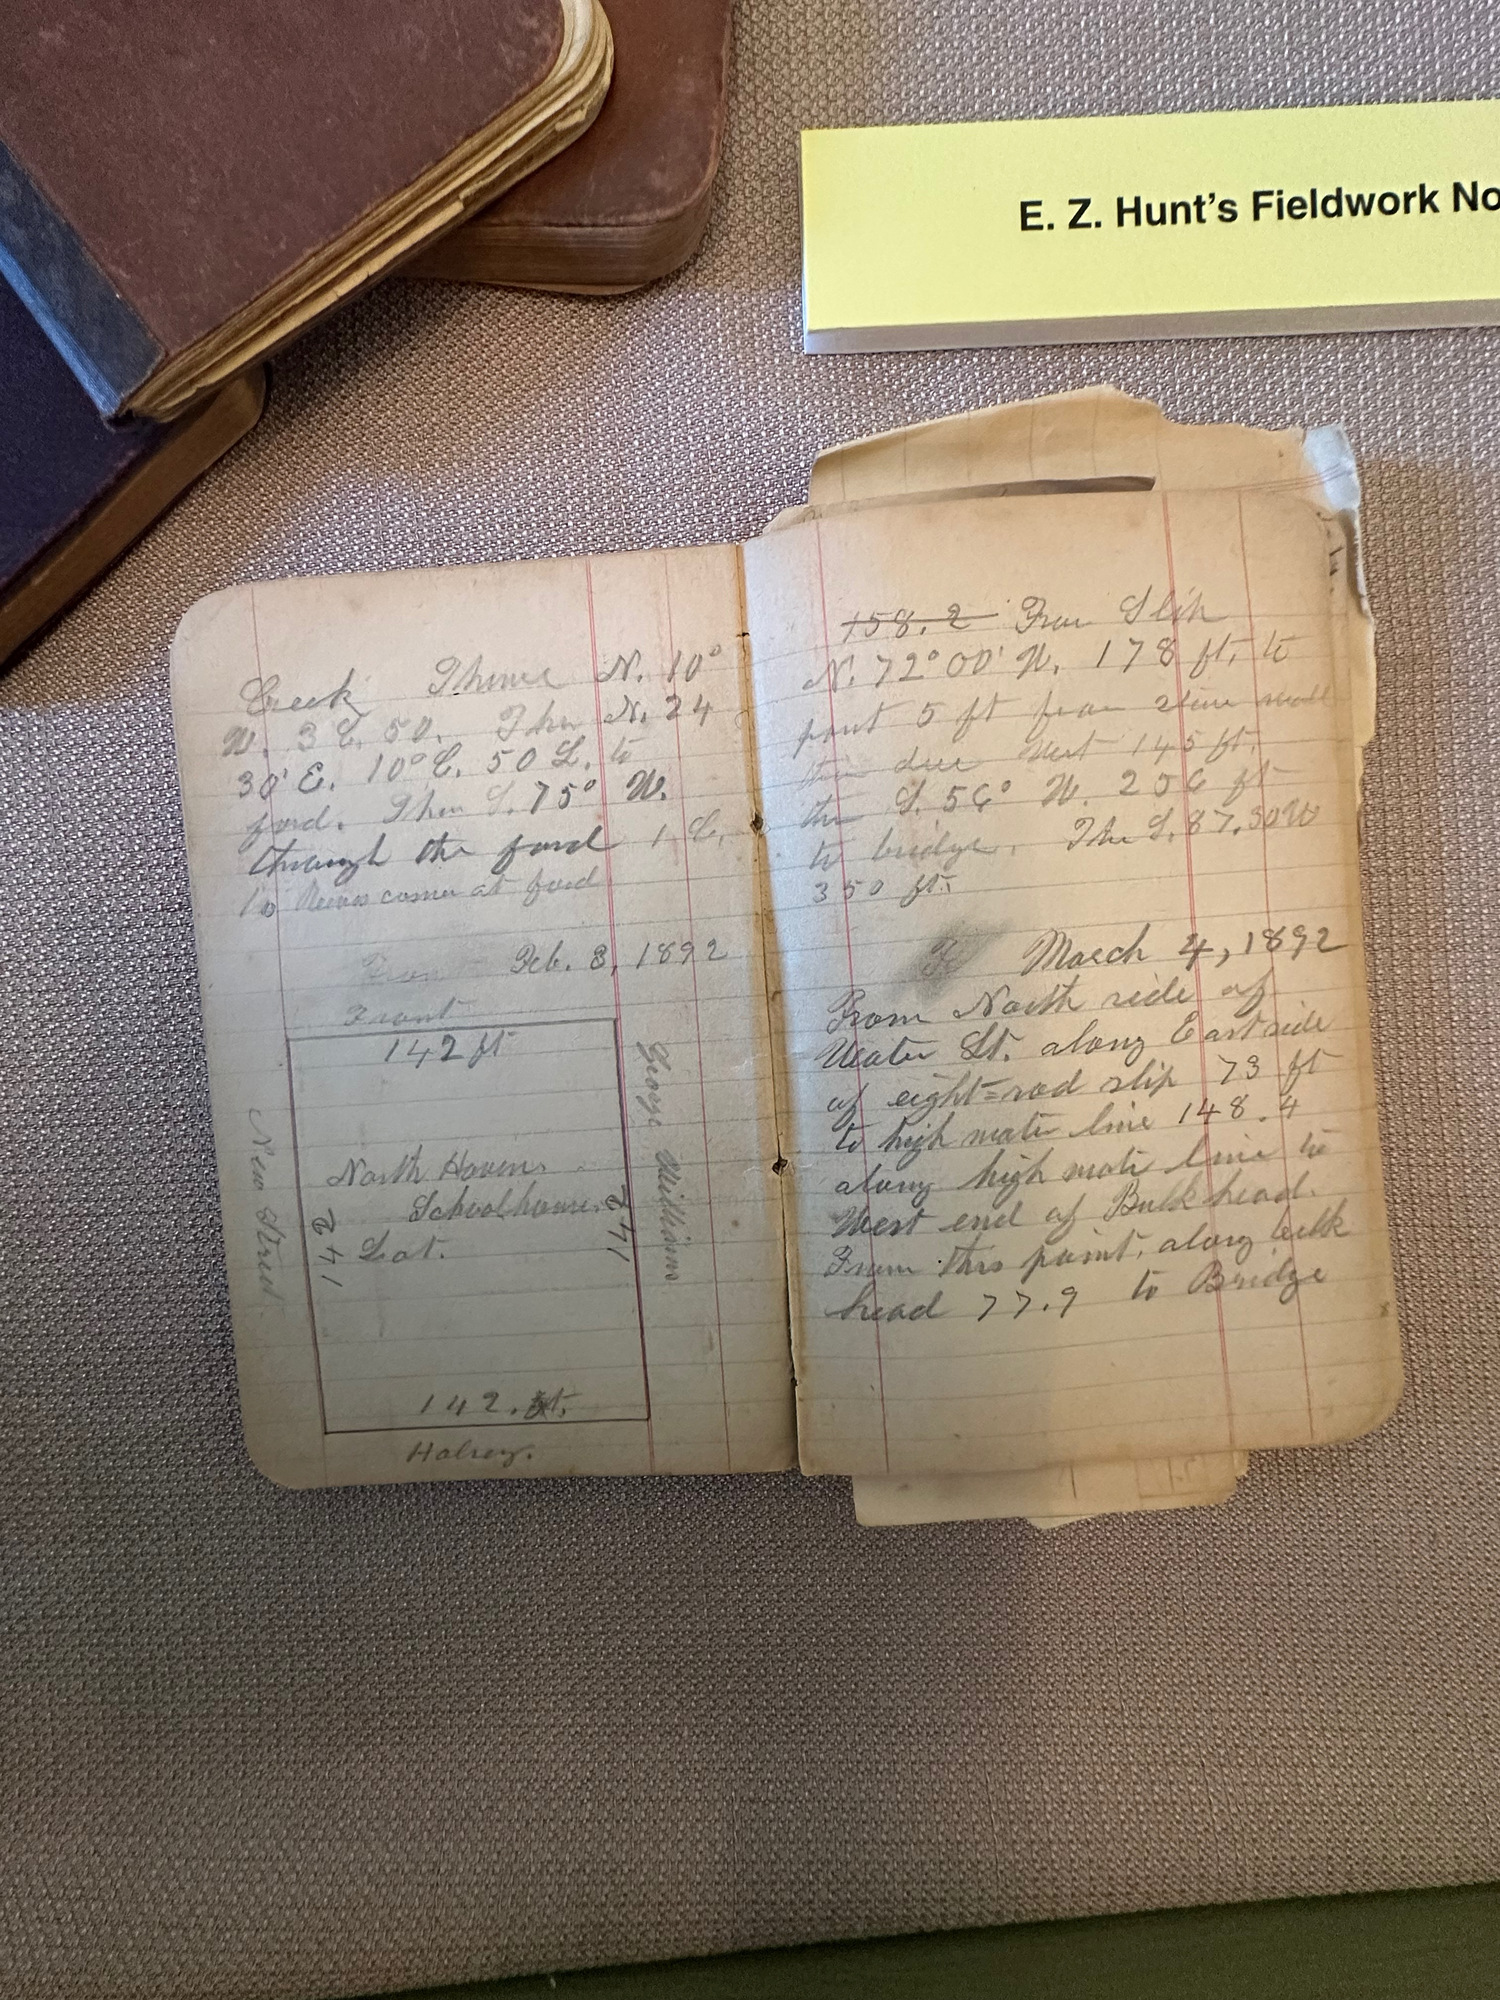
A fieldwork notebook that belonged to Sag Harbor surveyor E.Z. Hunt on view at the Sag Harbor Whaling Museum. ANNETTE HINKLE
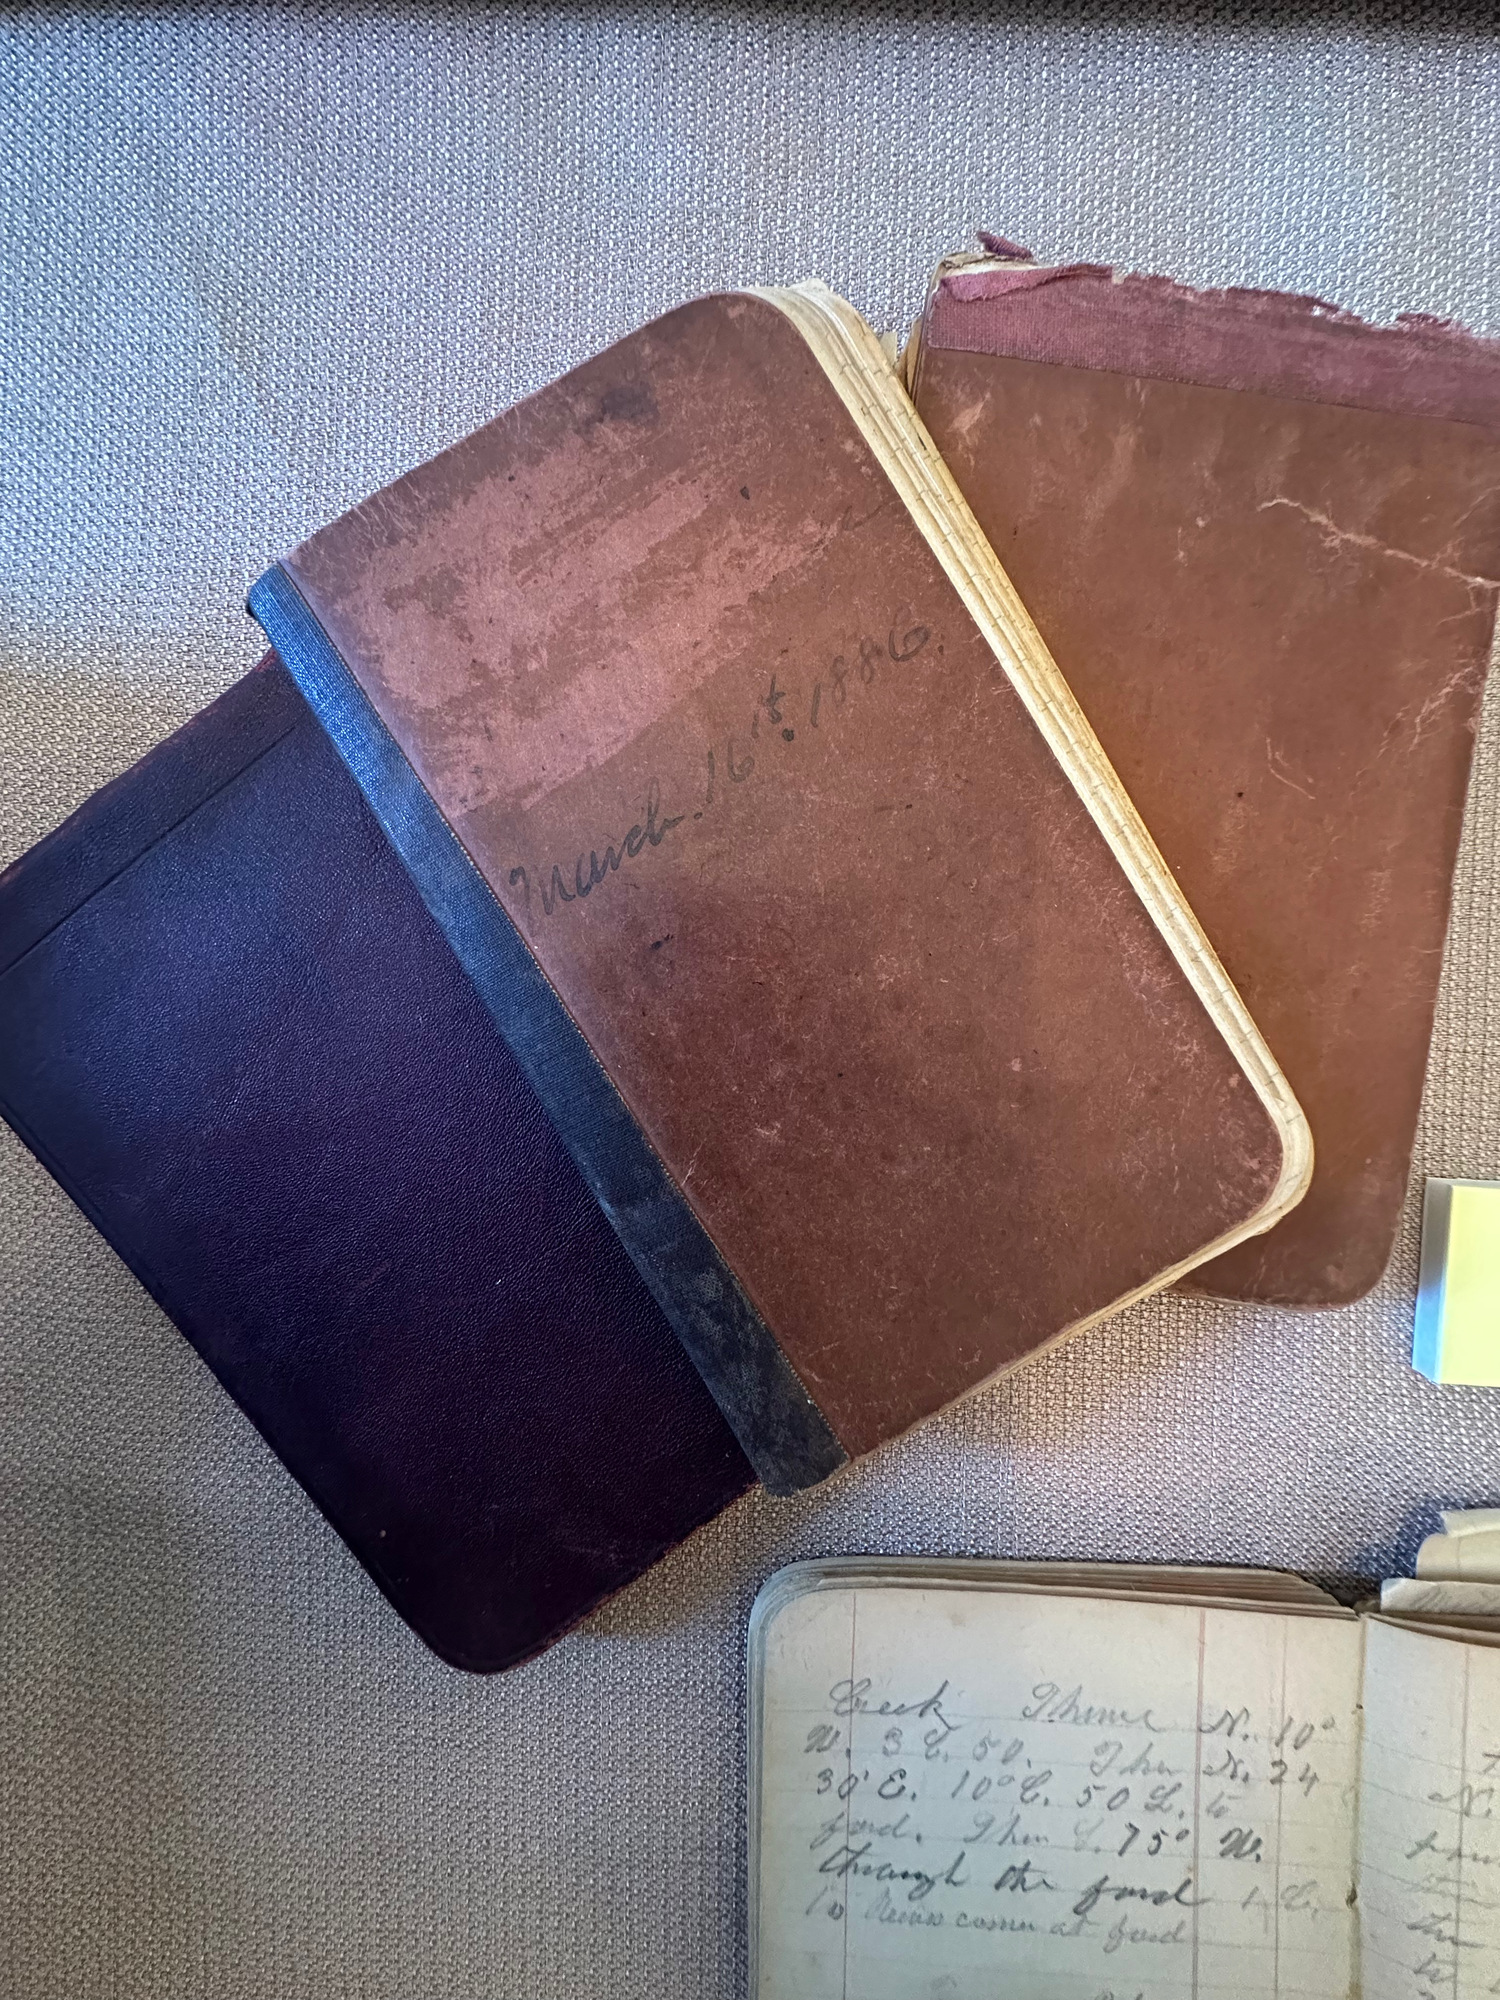
Fieldwork notebooks that belonged to Sag Harbor surveyor E.Z. Hunt on view at the Sag Harbor Whaling Museum. ANNETTE HINKLE
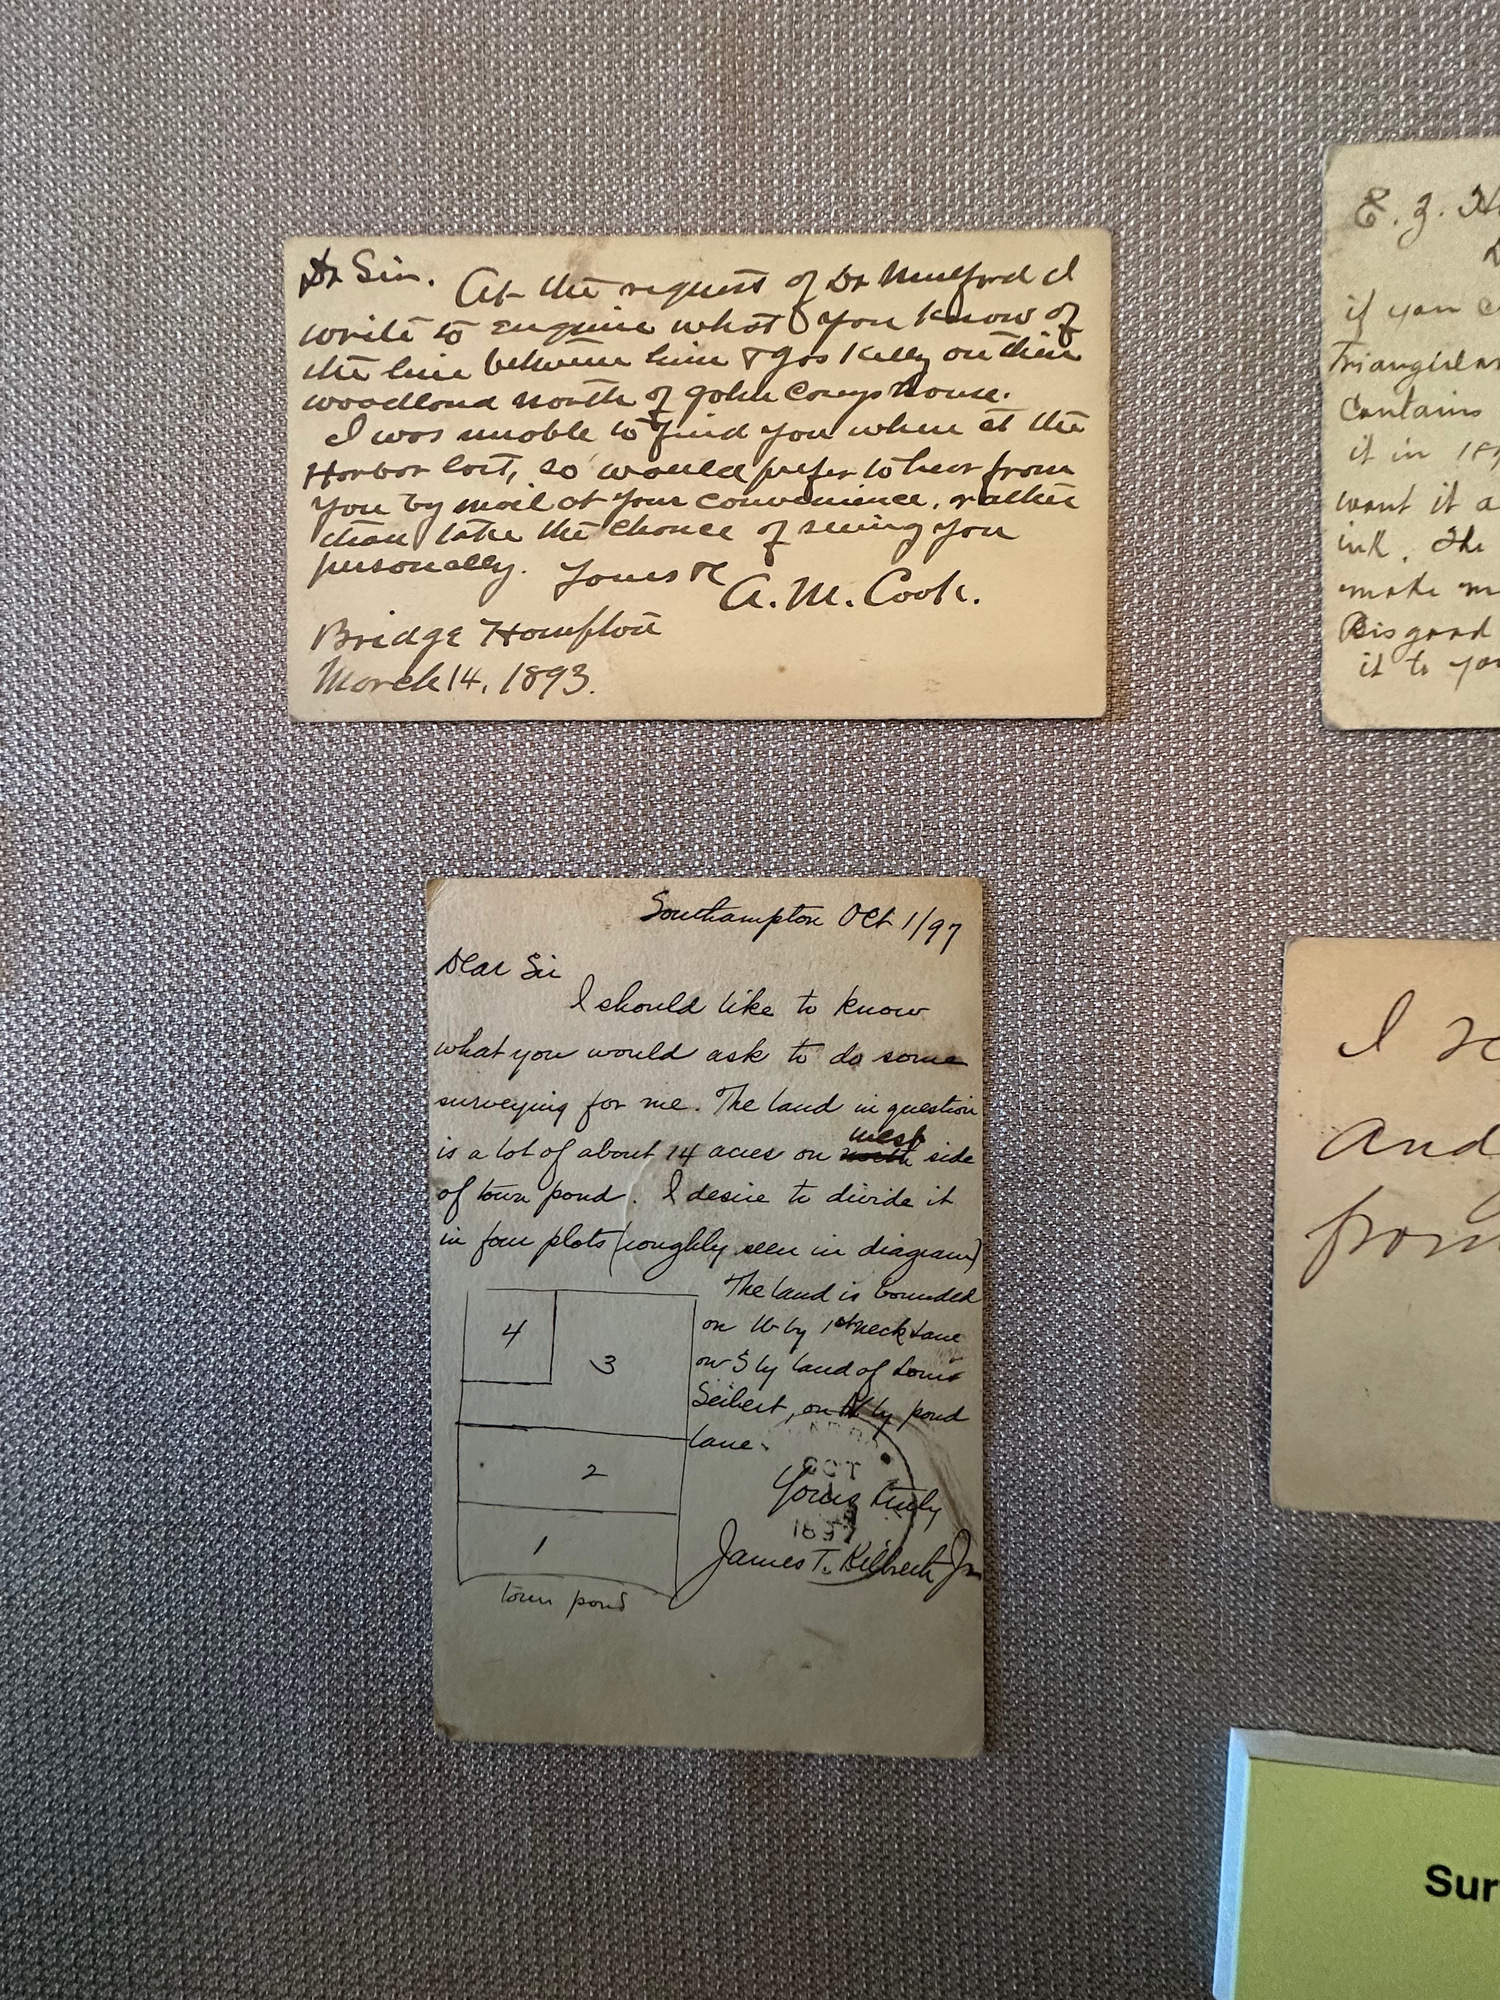
Notes that belonged to Sag Harbor surveyor E.Z. Hunt on view at the Sag Harbor Whaling Museum. ANNETTE HINKLE
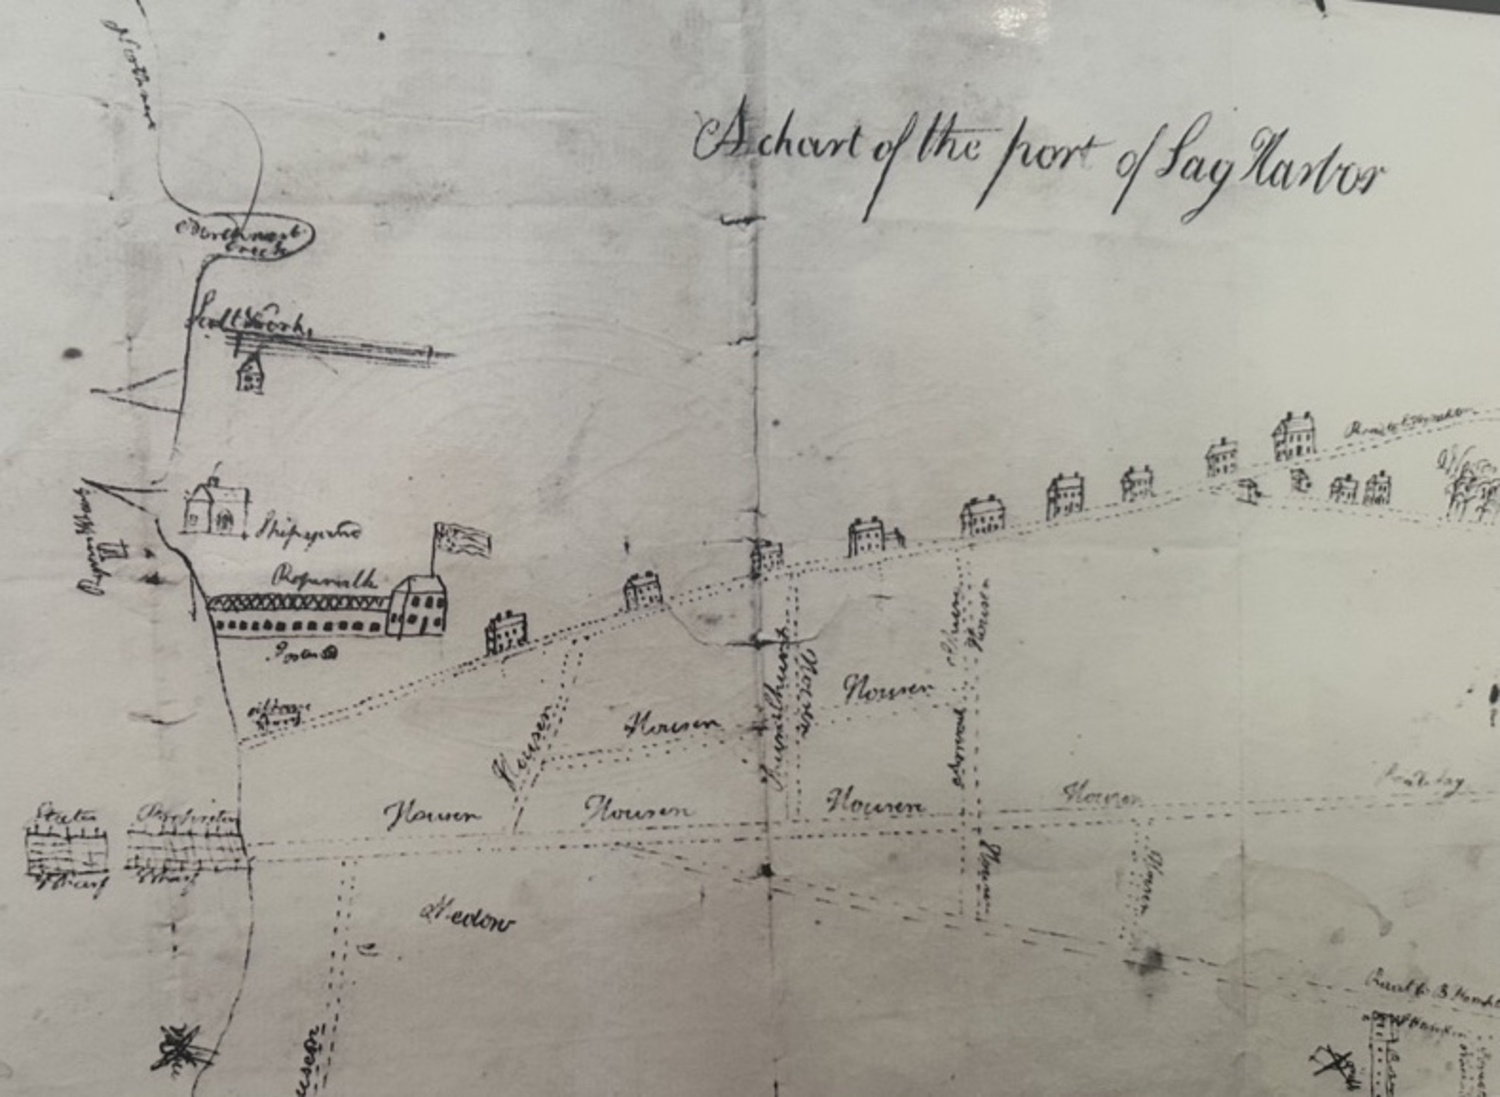
A Sag Harbor map from 1810 showing features such as the rope walk, shipyard and oil house. COURTESY SAG HARBOR WHALING MUSEUM
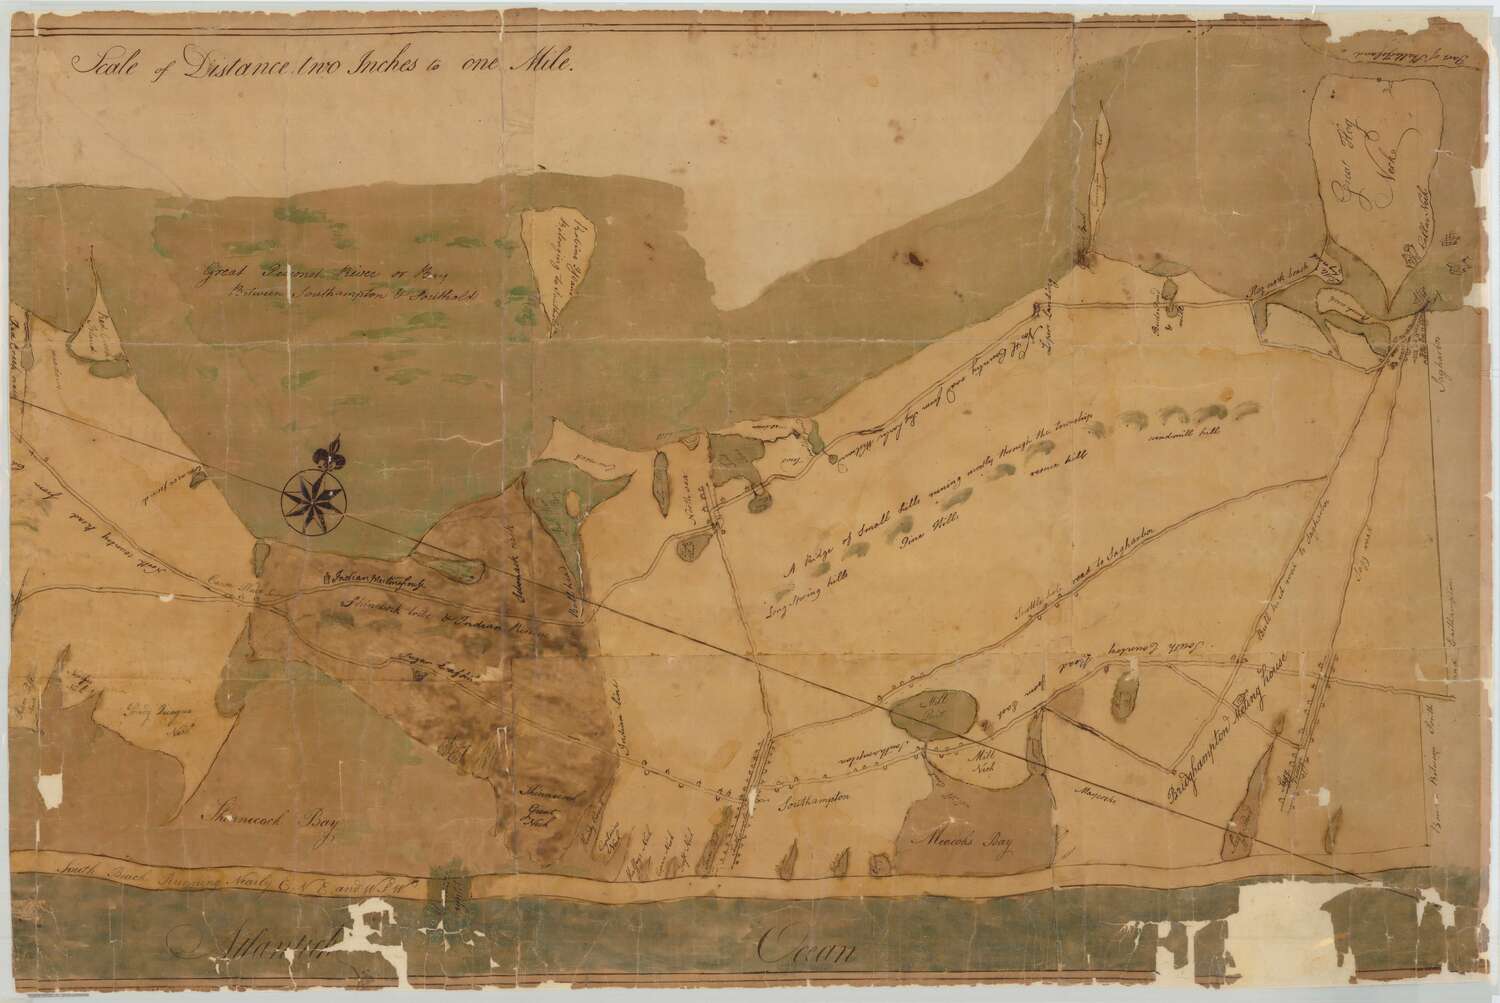
A c. 1790 map of Southampton. NEW YORK STATE ARCHIVES
“Sag Harbor is a pretty village, situated on a mere mass of sand,” wrote Yale University’s Dr. Timothy Dwight of his 1804 visit to the place, adding that it was the “excellent harbor” that drew people to “this unpleasant land — not unpleasant from want of prospect, but because it furnished unpleasant streets and walks, and is unfriendly to every kind of vegetation.”
Dr. Dwight obviously wasn’t a fan, but who could blame him? There wasn’t much to recommend Sag Harbor to the outside world back in those days.
But as we all know, that would one day change.
Though today, the layout of the East End’s villages and towns feels set in stone (and wood and plaster and concrete), when glimpsed in the context of history, what we see now is simply a snapshot of our time and place. Things inevitably change, and throughout the centuries buildings all around us have been built, razed, burned, moved and been rebuilt. Rural, dusty country lanes turned into streets, grew and expanded with population and industries, that also came, grew and often eventually, went away.
Several “views” of Sag Harbor over centuries can now be seen at the Sag Harbor Whaling & Historical Museum in “Fixed In Time and Space.” This compact exhibit offers glimpses of the village through maps dating from 1796 to 1921 that plot its streets, businesses, waterfront features and, eventually, homes.
Curated by the museum’s former director Richard Doctorow, who is now on the museum’s board, the concept for the show came about as a result of his other endeavors related to historic research.
“I spent a lot of time searching out maps for other exhibits,” he explained in a recent interview on the porch of the museum. “I realized there was enough information in maps themselves to make an exhibit, which is laid out chronologically and gives you a sense of the town.
“The exhibit traces the commercial and geographic history of Sag Harbor,” Doctorow added. “It began as this little maritime community and eventually hustled its way up to being one of the largest deep water whaling ports in the world.”
It seems evident from the earliest maps on view in this show that the village, originally inhabited by the Algonquin Indians, was viewed by early European settlers as first and foremost simply a place to do business — that is, bring goods in or send them out. That role defined Sag Harbor for much of its history.
“It was named a port of entry in 1789, which meant that if you wanted to ship anything to Long Island, you had to go to Sag Harbor to declare your cargo,” said Doctorow. “And then commercial whaling and fishing meant it developed in a very different way than the other agricultural towns around the East End. It was a mercantile and commercial center.”
The oldest map of the village on view in the show is dated 1796 and it offers a glimpse of all of Southampton Town at that time, though there wasn’t yet much to see. Doctorow explained that it was created after the American Revolution at the direction of the New York State Legislature, which passed a law mandating all towns in the state prepare a detailed map of its territory. What it shows of Sag Harbor is rows of crude little squares depicting buildings along Main Street. The wharf, which had been built in 1771, was a central focus of the map with all roads literally leading there.
Also depicted are three sailing vessels in the waters just off the wharf, illustrating the maritime importance of the village. A small circle shows Otter pond with a line leading to nearby Sag Harbor Cove — evidence of a canal that had been dug by Major John Jermain in 1792. It was believed that the elevation difference in the two bodies of water would be sufficient to power a water wheel. It wasn’t.
“There were not a lot of surveyors in America back in that time,” Doctorow explained. “Up until the American Revolution, plots had been done, but the concept of mapping Long Island was beyond the capabilities of American citizens, so they would come from Europe.”
Of course, the earliest views of Long Island would have been more focused on documenting the waterways surrounding it, as opposed to the land forms within it.
“The first maps were actually charts, which came earlier and were much more important,” said Doctorow. “Long Island had to be mapped early, because it was the way you get to New York City by ship. It was important to know where the rocks and lighthouses were.
“In the American Revolution, a lot of America was mapped properly and accurately. But most of that was done by the British army. The best maps were being done by them.”
Next in the exhibit comes a circa 1810 village map that is naïve in its rendering, but instructive in that it shows how industry had grown in subsequent years with simplistic drawings indicating the maritime importance of the place. The oil house, ropeworks, shipyard and saltworks are all documented in a childlike hand. Doctorow notes that the population was only about 850 at the time, and the area west of Main Street was still primarily open meadows.
“Clearly, even 100 years after first being settled, the village had some way to go,” Doctorow said, "and you can see this on the maps themselves.”
Also clear was the fact that Sag Harbor was emerging as a prominent whaling port — which brought a diversity of characters from near and far to its streets.
“The village itself was becoming more transient, rough and tumble — and dangerous,” Doctorow said. “What you would see here were things you wouldn’t see elsewhere. Men would come here to get themselves on a whaling ship other than going to jail — but you have to wonder which was worse.”
Despite the ruffians that frequented the place, the village did settle into a prosperous way of life with whaling, and by the mid-1800s, the sailors’ cottages, grand whaling captain homes and civic buildings had popped up around Sag Harbor. An 1854 map on view at the museum includes reproductions of daguerreotype images of many of the village’s most important buildings, and it also offered something else new — the names of owners of specific parcels.
“Who lived in what house is important at this time, and the map shows who owns what property,” Doctorow said, adding that it was less about documentation for military or government purposes, and more about sheer vanity. “If your name is on the map, you’ll want to buy it. By the 1850s, there was enough civic pride and middle class residents to do that.”
This map also depicts an industry in decline — specifically, whaling — and others on the rise. By the 1850s, whale populations had been decimated, kerosene was replacing whale oil as a fuel of choice, gold had been discovered in California and prospecting was a draw for many former whale men, and the number of whaling ships in the village’s fleet was declining — there were just 23 the year the map was created — a decade earlier there had been 64 such vessels based in the village. By the 1870s, the industry would be gone for good.
But the map also shows two new factories in the village — the Montauk Cotton Steam Mill at Washington and Division streets, and at the south end of the village, Oakland Works, a brass foundry that also began making clocks. Though neither survived for long, it was evidence of changing times.
By 1858, which is represented in a Chase map of Suffolk County, Sag Harbor showed evidence of what was to come — hotels catering to summer visitors arriving by steamship from New York, and a proposed Long Island Rail Road line on the east side of the village, something Sag Harbor had been clamoring for for years.
Alas, it wasn’t to be —the Civil War and other factors literally derailed the plan. It would be another 12 years before Sag Harbor would get its LIRR service on a more westerly track.
The maps in this show also document the history of Sag Harbor’s “Great Fires” — including the devasting blaze of 1877 — highlighting what was lost. Reflecting the need for accurate maps to determine property values for disasters of this nature, the turn of the 20th century brought about the Sanborn Map Company’s fire insurance maps, several of which are on view in the exhibit. The idea for the maps, which were used across the country, came from Daniel Sanborn, a 19th century civil engineer and surveyor who saw they could be useful to insurers.
“Mr. Sanborn realized fire insurance companies would have to send an agent out to access a property – which was very expensive and time consuming,” Doctorow said. “He saw a business opportunity. If he sent people out to make maps of every town and village, he could sell them to the insurance companies so they could just look at the maps, see the size of building, what it was made of, where it is, how many windows there are, how close it is to fire stations and what business it houses.
“It was just a goldmine of information. Almost like a flip book of its time.”
This exhibit isn’t only about maps — it also highlights the work of Edgar Z. Hunt (1823-1905), a Sag Harbor-born surveyor (and son of the founder of the Sag Harbor Corrector newspaper) who, in the early 1840s, set up shop in the village. Several of his field notebooks, correspondence and surveys (with math equations in the margin) are on view.
It’s a lot to take in, and when asked what part of putting this exhibit together Doctorow enjoyed most, he said “I loved it all.
“Even if you’re terrible at maps, come to the exhibit and have the fun of seeing if you can you find your house on them.”
“Fixed In Time and Space: Maps of Sag Harbor 1796-1921” remains on view through June 16 at the Sag Harbor Whaling & Historical Museum, 200 Main Street, Sag Harbor. For details, visit sagharborwhalingmuseum.org.


 Annette Hinkle on May 13, 2025